Data Visualization, Discovery and Visual Analytics – Tools, CoE


by Ravi Kalakota
There are many different ways of telling a story. Data visualization is the use of abstract, non-representational pictures to show numbers by means of the combined use of images, diagrams, animations, points, lines, a coordinate system, numbers, symbols, shading, words, and color-coding.  Visualization today has ever-expanding applications in business, science, education, engineering (e.g., product visualization).
A big complaint from business users…. BI platforms and big data today increasingly suffer from poor visualization.  Lots of tools, new technology and data but insights are hard to visualize from the background data noise.  It’s interesting how in almost every meeting I am in, Data Visualization (and Improving User Experience at even reports/dashboard level), is coming up as key business initiative.  There is a growing demand to enable everyday business users to answer questions with ease (self-service visualization).
Data Visualization initiatives tend to have four basic objectives:
  • Exploration of the content of a data set (e.g.,  location-based visualization in mobile applications that helps users complete tasks more instinctively, such as locating a hotel, checking inventory levels, or finding the closest store.)
  • Find structure in data (correlations etc.)
  • Checking assumptions in statistical models (causation etc.)
  • Communicate the results of an analysis in easy to consume way.
The challenge for executives and senior leadership today is – How do we increase the maturity of analytics and visualization area? In a fragmented landscape… how do we benchmark our current state? What structural changes – skillsets, toolsets, mindsets — need to be made to become world-class?  How can we drive more business value quicker from all these tool/platform investments?
DataVisualization

Better Data Visualization – a Growing Trend

“By visualizing information, we turn it into a landscape that you can explore with your eyes, a sort of information map. And when you’re lost in information, an information map is kind of useful.”  — David McCandless TED talk
The expectations of the enterprise users are rapidly shifting forcing BI and application developers to react. The focus is on enabling users to explore and analyze data with simple drag-and-drop operations.
Consumer user experience and engagement are the new standard for enterprise applications. Consumer innovations like iPhone which allow users to utilize drag-and-drop gestures to execute queries, seamlessly shift graphical perspectives on their data and easily answer new questions as their thinking progresses are the new norm.
Improving user engagement around data is a key strategic goal.  There is no disputing that organizations increasingly regard their data as a critical strategic resource. The remarkable growth in the volume, diversity and accessibility of digital information creates the potential for people to make more informed, timely and intelligent decisions.  Improvements in access, processing, and analytics speed can increase user engagement with data and enhance the range, quality and timeliness of insights that are developed.
Visualization improvements are key to comprehending data volume, velocity and variety. According to IDC, the amount of digital information created, replicated and consumed will grow from 0.8 trillion gigabytes in 2010 to 40 trillion gigabytes in 2020. Many organizations will experience a doubling in the volume of data across their enterprises approximately every 24 months, according to IDC, and are investing heavily to scale their data storage and management platforms to accommodate this growth. These growing volumes of data are also diverse in terms of their source, format and location.

DataFlow

End User Demand for Better Visualization

Reporting -> Scorecards -> Dashboards -> Interactive Visualization -> Analytical Modeling is the demand trajectory in most organizations.
In August 2012, Forrester Research estimated that there will be 615 million information workers globally in 2013 and it predicts that number to grow to 865 million by 2016. Additionally, a Forrester survey of information workers conducted in the fourth quarter of 2012 indicated that only 17% of respondents use a data dashboard or BI tools as part of their job. A significant percentage of information workers are not accessing BI software, and they instead use alternative approaches to meet their analytical needs.
As a consequence of the increasing richness and volume of data, knowledge workers are demanding agile analysis – faster access to information in order to gain insight, solve problems and monitor the performance of their organizations. The growth of cloud computing technologies and the proliferation of connected devices such as tablets and smartphones are enabling users to access information anytime and anyplace.
These trends are accelerating the demand for next generation Visual Analytics and Data Visualizationtechnology, as more information and engagement provokes more questions and fuels demand for more analysis, answers and value. At the same time, advances in user experience driven by consumer technology companies such as Amazon, Apple, Facebook and Google have raised user expectations regarding intuitive, flexible and convenient access to information.
These factors have created a backdrop of growing data resources, increased user appetite for information and rising expectations for accessibility and ease of use. As a result, many organizations are seeking technology that will allow their people to easily access the right information, answer questions, gain insight and share their findings. These organizations are seeking to empower their employees and to unleash their creativity and problem-solving abilities.

DataLeverage

Static Reports are Dead

Impactful and engaging visualization is the next frontier.
People within organizations have traditionally accessed data via static reports from enterprise applications and business intelligence platforms maintained by IT departments. These systems, predominantly designed and built in the 1990’s, are generally heavy, complex, inflexible and expensive. As a result, business users are forced to depend on specialized resources to operate, modify and maintain these systems.
The divide between users seeking insight and technical specialists lacking business context introduces inefficiencies and time lags that inhibit the utility and value of these systems. Because most business users lack the time, skills and financial resources necessary to address the limitations of these systems, their adoption has largely been limited to a narrow population of power users with technical expertise and training and to a narrow population of companies.
Faced with these challenges, many knowledge workers today rely on spreadsheets as their primary analytical tool. While spreadsheets are widely available and easier to use than traditional BI platforms, they have a number of limitations. Spreadsheets are not generally designed to facilitate direct and dynamic data access, making the process of importing and updating data manual, cumbersome and error prone. In addition, spreadsheets are not built to accommodate large data sets and offer limited interactive visual capabilities, thereby reducing performance and limiting analytical scope and insight.
Data-Dashboards

“Aggregate -> Explore -> Analyze -> Visualize”   Vendors

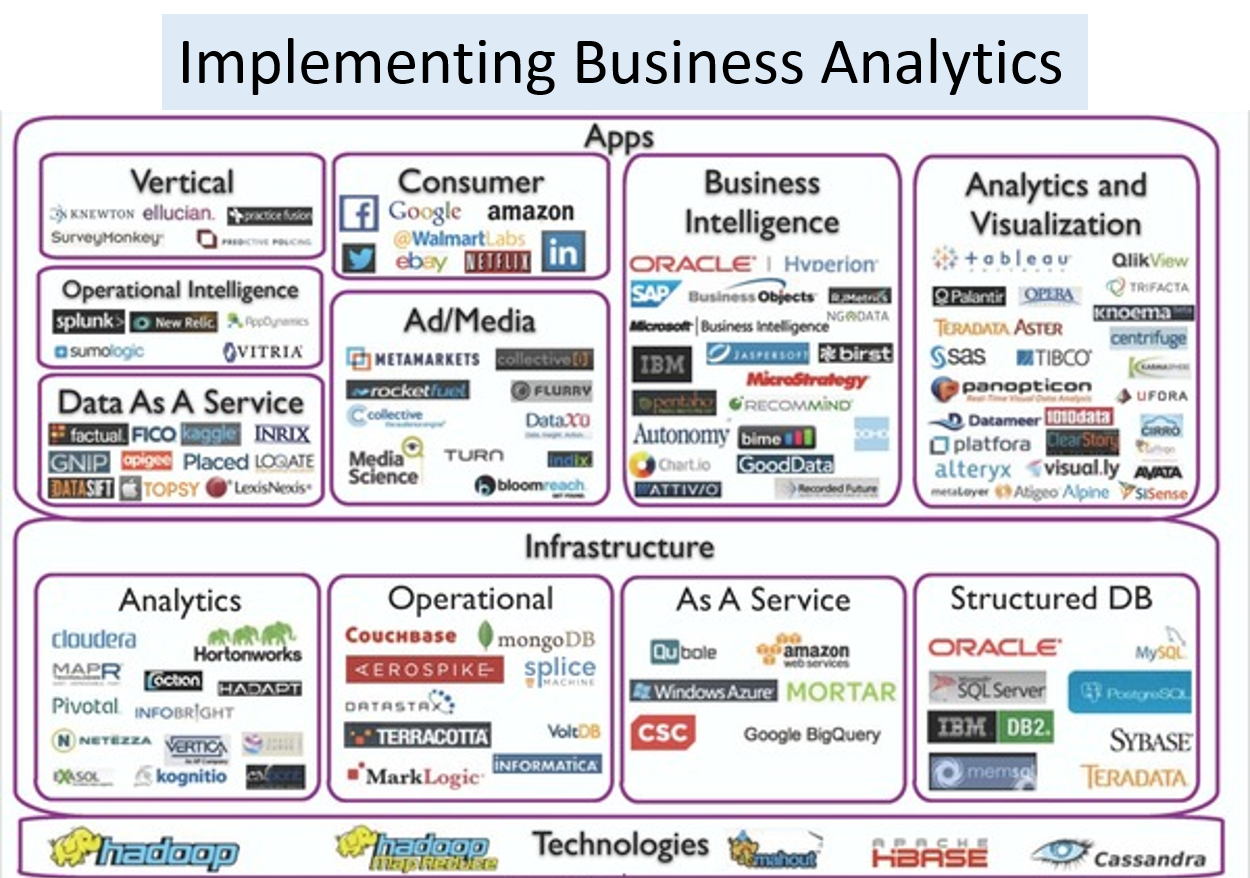
There are four categories of Data Visualization vendors
  • Spreadsheet software providers, such as Microsoft
  • Emerging business analytics software companies, such as Tableau Software, Qlik Technologies Inc. and TIBCO Spotfire.
  • Enterprise software companies, including suppliers of traditional BI products that provide one or more capabilities that are competitive with our products, such as MicroStrategy, IBM Cognos, Microsoft, Oracle and SAP AG;
  • Traditional Statistical vendors like SAS who allow you to do visual analysis… filter, sort, perform aggregations, and summarize;
  • and others..
Almost every vendor in the Business Analytics landscape is going after the Data Visualization space as a strategy.
ImplementingBusinessAnalytics

Vendor Focus…Bringing Data to Life

The focus is on allowing users to see and understand data.  More effective consumption of data is the target. The four capabilities that are needed to enable easier consumption of data include:
  • Self-Service — The simplicity and ease of use of next gen software vendors like Qliktech, Tableau Software or Spotfire gives people the power to access, analyze and share data without the assistance of technical specialists. This self-service capability democratizes access to data, expands the potential user population within organizations and reduces training and support costs.
  • Discovery — The human mind is better able to process information, discern trends and identify patterns when presented with information in a visual format. By integrating data analysis and visualization, our software allows people to create powerful visualizations and dashboards that can lead to new discoveries. New capabilities from vendors is designed to seamlessly blend, filter and drill down on information, without the distraction of dialogue boxes, wizards and scripts, allowing users to rapidly and iteratively develop greater insight from their data.
  • Speed — Enable people to derive value from their data at an accelerated pace. Due to a growing focus on ease of use and ease of deployment, enterprise users can quickly gain proficiency and generate results rapidly, without the complication, time investment and frustration often associated with traditional BI products.
  • Linkage — New software is able to connect directly to a broad range of data sources, enterprise users can perform work without having to undertake complex and time-consuming data movement and transformation.

QLIKVIEW

Tableau Software

COGNOSSAP BusinessObjects

SAS

EXCEL

  • Visualization
  • Data Discovery
  • Interactive Dashboards
  • Corporate Reporting
  • Dashboards
  • Ad-Hoc Query
  •  Statistics
  • Predictive Analytics
  • Data Mining
  •  Ad-Hoc Views
  • Business Analysts
  • Power Users
IT Report AuthorsStatisticiansAnalysts and Consumers

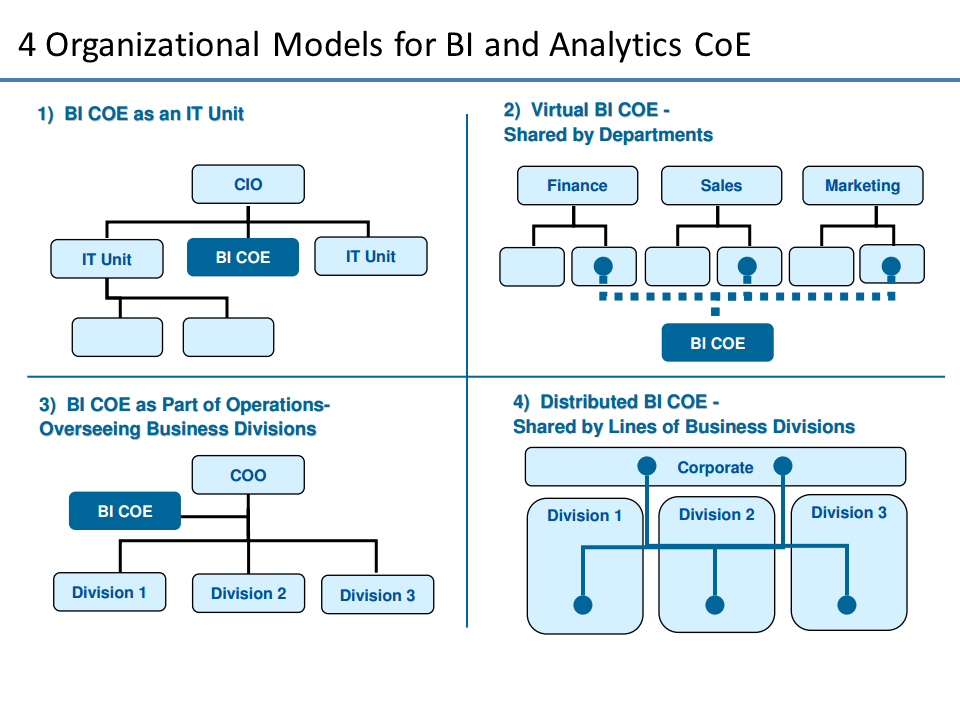
Enabling Better Decision Making via Data Visualization Center of Excellence (CoE)

“How do we create a flexible model for Data Visualization delivery that provides discipline at the core while giving the business the agility that they need to make decisions or meet client needs?”  
Decision making is inherently a core business activity. Slow, rigid systems are no longer good enough for business users or the IT teams that support them. Competitive pressures and new sources of data are creating new requirements. Users are demanding the ability to answer their questions quickly and easily.
The challenge for IT and Application Teams in every organization is to deliver exceptional business value to their business partners quickly and consistently while maintaining governance and control.  Establishing a Data Visualization Center of Excellence (DVCoE) ensures that the people, process and technology investments are not duplicated and addressed in a way that maximizes ROI and enhances IT-Business partnership.
VisualizationCharts

What is the business imperative being supported by DVCoE?

Reporting

 *Departmental ReportingStatic and/or parameterized reports built for internal user audiences – less need for pixel-perfect rendering and complex presentation
 *Corporate ReportingStatic and/or parameterized reports built for external and executive audiences (including regulatory reports) – pixel perfect and/or complex presentation
 *Ad-Hoc ReportingQuery or batch-based data delivery from one-off or custom requests – delivery in data set, spreadsheet or custom report form

Discovery, Analysis, and Visualization

 *Business DiscoveryVisual exploration of disparate data by business users for the purposes of discovery, what-ifs, scenarios, trending and correlations that are not yet known
 *VisualizationInteractive exploration of data by data practitioners, for the purposes of Pre-ETL, Correlation Analysis, Data Profiling, Data Quality, etc…
 *PrototypingRapid models and interface prototypes to prove out business value and technological fit

Advanced Analytics

Statistical AnalyticsStatistical analysis, trending and reporting – beyond basic statistical analysis.   These are statistical/scientific analysis based on advanced modeling.
 *Predictive AnalyticsPredictive analysis, projections, scenarios and models for future events based on historical data and controllable variables – beyond projections, what-ifs.

DVCoE — Fundamentals

How can we create a group that will help business see thru the noise of data. While every organization will vary in terms of what business needs they need supported…the basics of any DVCoE are the same.  They include Charter, People, Technology Process and Service Management.
  1. Charter and Setup

    1. Vision ->  Establish a guide post
    2. Executive Sponsorship ->  Eliminate roadblocks to change
    3. Delivery Patterns ->  Determine what will be delivered
    4. Project Intake ->  Outline how new work will be accepted
  2. People

    1. Roles ->  Determine what resources are needed
    2. Team Structure ->  Determine who will reside in IT or the business
    3. Collaboration Process -> Establish guidelines on how work is done and decisions made
    4. Onboarding Process -> Establish methods for on-boarding new people
  3. Technology Process

    1. Best Practices ->  Document development and UI guidelines
    2. Delivery Process ->  Develop process for application implementation
    3. Governance Model ->  Ensure ongoing environment stability and consistency
  4. Service Management

    1. Metrics & KPIs ->  Quantitatively define success
    2. Support Model ->  Determine who is responsible when help is needed
    3. Service Level Agreements ->  Establish committed SLAs
    4. Chargeback Model -> Establish mechanism for cost recovery
See my previous post on BI CoE or Competency Centers for a more in-depth discussion.
BI CoE Slide

Sources and References

  • http://en.wikipedia.org/wiki/Visual_analytics
  • The Visual Display of Quantitative Information by Edward R. Tufte
  • Qlikview in the Enterprise – Center of Excellence
  • Statistical graphics, also known as graphical techniques, are information graphics in the field of statistics used to visualize quantitative data. Whereas statistics and data analysis procedures generally yield their output in numeric or tabular form, graphical techniques allow such results to be displayed in some sort of pictorial form. They include plots such as scatter plots, histograms, probability plots, spaghetti plots, residual plots, box plots, block plots and biplots …http://en.wikipedia.org/wiki/Statistical_graphics
  • Journalism in the Age of Data…  http://datajournalism.stanford.edu/
  • A great Tumblr blog for visualization examples and inspiration: vizualize.tumblr.com
RaviSignaturePNG
IoT Links:

Mindset over Data Set - Sand Hill Big Data Study

Posted by Shirish Netke and M R Rangaswami 
“Meeting adjourned!” the chairman announces. In one swift move, I’m out of my chair and walking toward the door ahead of the other board members whenReport I hear my name, and there’s no mistaking that voice. 
“Dana,” says Bill, the chairman of the board. “Could I speak to you a moment?” His tone is far more serious than when he addressed the board meeting with stellar quarterly results just a few minutes earlier.
I return to the conference table, outwardly confident yet searching my mind for what he could possibly want to discuss. Could it be about the acquisition we plan to make? Perhaps it’s related to the construction of our new smart manufacturing plant? Or maybe it pertains to the upcoming strategic-planning initiative?
“Thanks again for delivering the best quarter and fiscal year results in our history,” Bill begins. “This is a marked change from where we were heading before you arrived a few years ago. Let’s hope the Street feels the same way after our analyst call tomorrow.”
“A lot of it may be factored into our stock price,” I say.
Bill continues. “I hear that some equity analysts are asking data analytics questions even of old-line traditional businesses like ours. Terms like Big Data and predictive analytics are new to us. I realize that every business can use technology to be more efficient. But should we be jumping on the flavor of the month that business schools, journalists and analysts throw at us? I ran this company for three decades, long before these management gurus were around, and I did not have to deal with this. Anyway, the reason that I wanted to talk to you is that I heard that our competitors from California are calling themselves a data-driven company.”
“Actually, Bill, this Big Data stuff is big, but it’s not just about data.”
“Then what is it about?” Bill is surprised. 
“It’s about a mindset for making business decisions,” I say. “What if I told you that we are already using Big Data to grow our business? Also, analytics is one of the reasons why we have been so successful. Remember our discussion on how we tweaked our shop-floor workflows in one factory and added $25 million to the bottom line in 2013? We did that by collecting machine data on our assembly line, analyzing patterns and asking a series of questions on the impact of changing the workflow for the machines.”
I continue. “A key element of our execution was using the tribal knowledge of our team in deciding among alternative workflows to make improvements to our process. They did that very well.”
Bill smiles ever so slightly and then says, “Sounds simple enough when you take out the jargon. But isn’t this just everyday stuff on the shop floor with a little help from our computers? I really don’t understand what all the Big Data fuss is about.”
“The main difference now is that new technologies allow us to analyze large amounts of data from a variety of data sets to improve our ability to predict outcomes,” I explain. “We use these predictions to evaluate different courses of action and make major decisions. In fact, when used properly, they let us do things that we could not do before, such as add $25 million to our bottom line. The big deal is not just that we have a lot more data. It is that we effectively applied new technologies to use this data to improve shareholder value.”
“Like any other new technology, Big Data is hard to implement since we have to make organizational changes, there are no best practices and there is a talent shortage. We like to think of our early adoption of a data analytics approach as a means of gaining competitive advantage.”
“I’m glad you explained this in simple terms. As you know, I’m on the board of a transportation company that was a market leader for many years. They were doing everything right and were at the top of their game. But in recent years, they seem to have lost their way. They are now worried about losing out to Amazon, which could undercut their whole model by using drones to deliver packages in 30 minutes. Amazon even has a patent for ‘anticipatory shipping’ to start delivery of a package before a customer decides to buy. How do you compete with that?”
It’s a harsh reminder of how quickly the world can change, I think. Even companies that aren’t resting on their laurels are not immune. Success today requires a heightened awareness of the business and all its operations, its customers and their constantly increasing expectations, its competitors and the market disruption they can cause, and the economy and its influence on all of the above. How do you make sense of it all in a way that catalyzes timely and effective action?
I finally say, “We faced similar issues when I joined this company. I found the decisions we were making, our so-called informed decisions, weren’t as informed as we thought. We had data and we had smart people, but our analyses sometimes missed important insights. The issue was really that the volume and complexity of our data outstripped the capabilities of the tools we had to make sense of it all.
“A light went on for me after hearing the CIO of a financial services company say that using status quo tools is like bringing a knife to a gun fight,” I say. “I decided that I would rather be the one bringing a gun to a knife fight. That began our journey to the results we just produced.”
“How did you start the process?” Bill asks.
Until today Bill and I had never discussed any subject this much. He wasn’t even really aware of what Big Data was. What he did know was that our company was enjoying record results.
I continue. “When it comes to Big Data, it’s all about building the right mindset in your organization. You need to see yourself not as a ‘widget company’ but as a ‘data company.’ It’s about exploration with a clear purpose, being open to new perspectives and moving forward based on correlation rather than causation. It’s a cultural shift that must be established at the top and championed throughout the organization.”
“Why is that?” he asks.
”I’ve spoken to several other CEOs that succeeded with the mindset approach,” I reply. “There is a significant correlation between the analytics mindset and financial success. The results are better when Big Data is a priority backed by the resources of top management.”
“What specifically have you seen your peers doing?” he asks.
“They are focusing on the fundamentals of their businesses and seeing how they can improve them with advanced analytics. Specific steps include aligning their people, technology platform and ecosystem of partners to work toward achieving their business goals.”
Bill gets it. “I’m a big racing fan, and we always talk about how Ferrari and McLaren prepare for Formula One with human resources and technical resources,” he says. “Like any business, you need a lot of factors to work together to win the race. Most important, you need a leadership mandate to set the pace.”
Bill suddenly slaps his hand on the table, and I jump back a little. “I’m so glad we brought you in to run the company, Dana! I’m going to have the CEO of the transportation company connect with you. You just might help bring his company back as a pacesetter, just like you have for us.”
Shirish Netke is president and CEO of Amberoon Inc.
M.R. Rangaswami is co-founder and CEO of Sand Hill Group and publisher of SandHill.com.
(Originally published in SandHill.com)

MIndset Over Data Set: A Big Data Prescription for Setting the Market Pace
This study focuses on an executive-level prescription for implementing a successful Big Data initiative and is based on feedback from 160 real-world practitioners. The report also includes unique insights gleaned from one-on-one interviews with those responsible for Big Data initiatives at 25 large enterprises with combined annual revenues of more than $1.43 trillion. Like Sand Hill’s past studies on cloud and mobility, this Big Data study provides a qualitative perspective from the executive suite and is based on in-depth interviews with top-tier decision makers that will influence investment in Big Data technologies in the enterprise in the next few years.

Related:: Turn your Data Streams into a Data Lake_source=bizo&utm_medium=nurture&utm_campaign=datalake

Mission Critical

PricewaterhouseCoopers Keywords Magazine Vol. 9


Data driven

Two PwC alumni explain how Big Data is making the leap from the intelligence community to the private sector.

Jim Reagan
Data analytics have almost countless uses, but aren’t useful to a customer unless you marry the data with the right application.
Big Data—with a capital B—involves sifting through terabytes upon petabytes of information to draw connections, identify patterns and find meaningful analysis. From academia to the tech sector, it’s being hailed as a game-changer, with potential to revolutionize healthcare, spot business trends, stay one step ahead of criminals and combatants, and even change the way we record and view world history. But how?
To find out, Keyword recently spoke with Jim Reagan, senior vice president and CFO of The SI Organization, Inc., and Drew Perez, Intelligence Solutions at HIGHFLEET—two PwC alumni who are navigating a world of data that few dive deep enough to explore.
“It’s difficult to imagine, or even put a limit on, the importance of Big Data, whether it’s in defense or public services or the private sector,” says Reagan. “Twenty years from now, we’ll look back and realize we’re doing things we never could have imagined, thanks to having more available data and more ways to put it to work.”
Big Data is hardly a new concept. Ever since the first satellites, radar sensors, mobile devices and recording instruments started collecting and transmitting information, people have recognized the value of voluminous data. But they’ve also struggled to figure out how to use it. “The challenge is not one of gathering data, which happens continuously,” says Perez. “The problem is understanding what it means.”
For the intelligence community, finding such clarity can make all the difference. In the world of counterterrorism, make-or-break decisions involve national security, so the more complete the view of the information, the better. Big Data analysis helps agencies dealing with classified information forecast and deploy resources, as well as make tactical and strategic decisions. Perez points to the OODA Loop decision-making cycle (Observe, Orient, Decide and Act), a staple framework of intelligence created by Korean War fighter pilot Colonel John Boyd and taught everywhere from the War College to noncommissioned officer courses. Those who move through the cycle quicker, observing and reacting to events more rapidly than their competition, eventually “get inside” the opponent’s decision cycle to gain an edge.
“You live in their future,” Perez says. “You’re deciding and acting and operationalizing your decisions as they’re just orienting themselves and observing the environment—and you have a significant strategic and tactical advantage.”
Homing in on the most relevant information right away makes that edge possible. So how do you shave off seconds and potentially pile on an advantage? By understanding the meaning behind data that’s coming at you from all angles—and fast. The same logic applies in the private sector, where methodologies to make sense of overwhelming amounts of available information are still in the early stages. “There’s an untapped market for the use of Big Data,” Reagan says. “We’ve been helping government clients manage Big Data for years. Now, we’re eager to make it more available.”

Applications abound

Jim Reagan has been finding meaning in numbers since his early career as a staff auditor with Coopers & Lybrand in the 1980s. He moved along the audit path, primarily working in the real estate and government contracting sectors in Washington, D.C., where he was on the first audit team to ever comb through the Smithsonian’s financial books. “That was very cool,” he says. “It involved reconstructing a lot of very, very old financial records since they’d never been audited before.” Lessons in teamwork at the core of entry-level audit positions in public accounting firms—along with an education in real estate development and the government services sector—prepared him well for his early career posts.
Reagan went on to become CFO of PAE, Inc., which works to support the Defense and State Departments in Afghanistan, Iraq and Central Africa. Drawn by a connection to PAE’s mission to provide logistical support for peacekeeping and global security worldwide, Reagan helped refinance the company’s debt while developing cost structures to succeed in the ultra-competitive world of government contracting.
Now as the CFO at The SI Organization, Inc., Reagan is helping to diversify the company’s business to appeal to state and local governments, as well as private-sector customers. With potential belt-tightening looming, the SI is looking to Big Data analytics around geospatial data—the kind streaming in from commercial and government satellites, high-flying aircraft, radar and sensors that inform things like GPS devices, weather forecasts, commercial shipping routes, crop forecasts and tax assessments. As the data is cleared for release into the private sector, applications abound. “Data analytics have almost countless uses,” Reagan says. “But it’s not useful to a customer unless you marry the data with the right application.”
The SI hosts and brokers huge databases of geospatial information that both federal and local governments can repackage and make available to third-party providers. Their muscle memory built upon more than 40 years of supporting classified customers is strong, Reagan says. And now the SI is looking to leverage that know-how to build bridges between private-sector data owners, application providers and their customers. “We’re a data-driven company—that’s our legacy, it’s who we are,” Reagan says. “Data is behind every decision we make.”
Currently, the SI is working on applications that help governments at every level organize and cull data for value-added uses in the private sector, particularly in healthcare. Data analytics and capabilities enable more proactive forecasting, prevention and detection of Medicare and Medicaid fraud. Healthcare providers are also seeking to develop ways to better use electronic health records to diagnose patients, research disease and allow patients to play a more active role in their care.
“It’s everything from seeing someone’s symptoms at the doctor’s office to making sure the patient gets the right treatment so they don’t end up in the emergency room the next week,” Reagan says.
As anyone who’s filled out forms in a waiting room can attest, there’s plenty of data to be collected. But information is not intelligence—far from it. The whole nature of intelligence is supporting critical decisionmaking; information, however much, is just one small piece of the puzzle.

Plunging into the Deep Web

A former intelligence officer, Perez trained special forces in tradecraft—“your classic spy stuff,” he quips. From 2000 to 2002, he was a senior enterprise architect at Diamond Management and Technology Consultants, which joined with PwC in 2010. Perez spent most of his time with Diamond in Europe, focused on strategic technology transfer agreements. His work there helped him develop and refine skills within enterprise architectures, particularly when his experience forced him to simultaneously adopt corporate and national cultures.
Perez began his private-sector career by co-founding the Lockheed Martin Center for Security Analysis, where he helped create training programs for intelligence analysis and software used by the CIA, NSA and Defense Intelligence Agency. At the request of the Department of Homeland Security, he developed a declassified version of the program for a range of private- sector clients. “Pick any vertical, and you find a problem with too much data in too many places,” Perez says. “The core issue remains sense-making.”
One key technology is accessing Deep Web data—the kind that search engines and web crawlers don’t find— to create applications that efficiently convert disparate, disorganized data into structured, searchable formats. These applications understand foreign languages, apply link analysis to recognize relationships and use analytics to visualize the data. They’re all tools that matured in the counterterrorism effort but have yet to be taken advantage of in the private sector, and their capabilities provide a distinct competitive advantage for businesses. The ability to monitor and almost instantaneously make decisions on markets and customer behavior or to assess strategic position related to the competition, targeted demographic or market, Perez says, is key.
This is why Perez often gets the same set of questions from potential clients once they learn about his capabilities. “They ask, ‘How come we’ve never heard of this before?’ or ‘Why is it you guys know how to do it better than we do?’” Perez says. “Well, because I did work that used to be classified, that’s why.”
In counterinsurgency, support from the local populace is the cornerstone of success. To help win over “hearts and minds,” intelligence focuses on people’s past and potential behavior, along with the patterns that decision- makers hope to both understand and eventually influence. Similarly, in business, the support of the market provides the cornerstone to profitability. Applying time-tested methodologies and related technology to identify behavior patterns for markets, Perez says, can lead to an enormous advantage.
Drew Perez
Pick any vertical, and you find a problem with too much data in too many places. The core issue remains sense-making.
“It’s a no-brainer when you’re dealing with the intelligence community, because they’ve been doing this for decades,” Perez says. “In the private sector, it’s a significant investment—and you’ve got to articulate and justify return on investment.”
For Perez, there’s no better way to do that than to provide a real-world example of Big Data’s power. Case in point: A pharmaceutical client turned to Perez to leverage the counterterrorism tools he’d developed to identify counterfeiters. Perez architected and implemented a solution to monitor, in near real time, worldwide e-commerce activity connected to the pharmaceutical company’s product and figure out the probability that it may involve fraud. It took two weeks to set up the software, designed to troll well below the headwaters of the Internet indexed by search engines and web crawlers and to make sense of it all. Once they flipped the switch, a collection of data that might have taken the company months to compile took just hours to capture.
“By the seventh hour, we had saturation,” Perez says. “We were monitoring the whole planet. Anytime somebody engaged in any kind of transaction that mentioned that company’s products and violated the rules on pricing, I knew.” The capability is meaningful given what can be gained with the ability to monitor comparative product performance and market behavior in real time.

Big rewards, big challenges

Reagan says some clients come to the SI with an understanding of Big Data’s potential, and some don’t. One thing they do know is that the investment in infrastructure for data storage space and bandwidth can be huge. “Some of these agencies have terabytes of data, and for them, it’s a storage headache and a cost,” he says. “We can help show them how they can manage data more effectively and how they can get some return on the investment by making the data available for resale.”
Perez says ROI will become more tangible as better solutions are developed to link data in disparate locales: It’s not a question of whether or not we can get data; it’s a matter of knowing where the right data is. The information that decision-makers need may already exist internally within a company’s data stores, but individual files can still be literally all over the map.
“It could be sitting on a SharePoint file in Dubai, and that little piece of information has to be associated with a large data warehouse that’s sitting in Buenos Aires,” Perez says, noting that intelligence analysts simply don’t have the time or resources to go through all the data. But Perez says moving data to the same location is not the answer in this day and age. Technology exists that connects information seemingly far out of reach. “You don’t have to physically touch a data point,” Perez says. “You can associate it through depth of logic.”
Of course, storing, managing and capitalizing on the seemingly unlimited potential of data all come with the challenge of protecting it. According to PwC’s 2013 Global State of Information Security Survey, many organizations fail to perform thorough assessments of factors that contribute to breach-related financial losses. In fact, just over 25% of respondents considered damage to brand and reputation when estimating the full impact of a breach, while the same survey found 61% of respondents would stop using a company’s products or services after a breach.
From advanced persistent threats linked to foreign governments to insider threats made by disgruntled or corrupted employees, economic espionage is a growing concern. The White House has responded by issuing an executive order calling for the creation of a framework to reduce risk to critical infrastructure and ease sharing of threat information with the private sector. But individual organizations must find their own balance: Strong “need-to-know” control mechanisms must be enforced yet somehow tempered to allow collaboration. In PwC’s survey, more than 80% of respondents said protecting customer and employee data is important. Still, the percentage of respondents who reported an accurate inventory of employee and customer data remains below 40%.
To address gaps like these, the SI provides customers with technical advice and consulting around protecting national assets from the threat of cyberattack. Large corporations, banks and power companies may be dealing with thousands of attempted attacks per day, and Reagan says the SI is equipped to weather the storm. The company employs a Threat Operations Center (TOC) in Laurel, Maryland, to monitor its financial accounting system, human resource management system, payroll and internal email. It also has a separate TOC that’s focused on its customers’ needs, constantly monitoring, detecting and fending off cyberattacks from the outside. “All of our systems that have touch points to the Internet are protected,” says Reagan, who notes the SI customers’ data is kept on closed systems.
“In our work we’ve found significant evidence of Theft of Trade Secrets (ToTS) in our monitoring efforts. If sensitive material is not categorized and properly labeled based on the impact of unauthorized disclosure or dissemination—and personnel are not trained in the culture of information security—then it is very difficult to protect sensitive information and intellectual property,” Perez says.
The concerns are real, and new regulations to protect privacy and address issues of consent, collection, use and misuse of data are sure to come. As more data becomes available for more applications, challenges will undoubtedly continue to present themselves. But Reagan and Perez agree: Big Data’s power can’t be underestimated. In defense and intelligence, it’s proved to be an indispensable tool. Now in the private sector, Big Data has the potential to be nothing less than transformational. “Once you turn this stuff on and implement it,” Perez says, “you rule the market.”

Related:  http://www.cio.com/article/2683969/leadership-management/the-cio-as-vc.html

A Cheap Spying Tool With a High Creepy Factor

AUGUST 2, 2013, 4:58 PM
Brendan O’Connor is a security researcher. How easy would it be, he recently wondered, to monitor the movement of everyone on the street – not by a government intelligence agency, but by a private citizen with a few hundred dollars to spare?
Mr. O’Connor, 27, bought some plastic boxes and stuffed them with a $25, credit-card size Raspberry Pi Model A computer and a few over-the-counter sensors, including Wi-Fi adapters. He connected each of those boxes to a command and control system, and he built a data visualization system to monitor what the sensors picked up: all the wireless traffic emitted by every nearby wireless device, including smartphones.
Each box cost $57. He produced 10 of them, and then he turned them on – to spy on himself. He could pick up the Web sites he browsed when he connected to a public Wi-Fi – say at a cafe – and he scooped up the unique identifier connected to his phone and iPad. Gobs of information traveled over the Internet in the clear, meaning they were entirely unencrypted and simple to scoop up.
Even when he didn’t connect to a Wi-Fi network, his sensors could track his location through Wi-Fi “pings.” His iPhone pinged the iMessage server to check for new messages. When he logged on to an unsecured Wi-Fi, it revealed what operating system he was using on what kind of device, and whether he was using Dropbox or went on a dating site or browsed for shoes on an e-commerce site. One site might leak his e-mail address, another his photo.
“Actually it’s not hard,” he concluded. “It’s terrifyingly easy.”
Also creepy – which is why he called his contraption “creepyDOL.”
“It could be used for anything depending on how creepy you want to be,” he said.
You could spy on your ex-lover, by placing the sensor boxes near the places the person frequents, or your teenage child, or the residents of a particular neighborhood. You could keep tabs on people who gather at a certain house of worship or take part in a protest demonstration in a town square. Their phones and tablets, Mr. O’Connor argued, would surely leak some information about them – and certainly if they then connected to an unsecured Wi-Fi. The boxes are small enough to be tucked under a cafe table or dropped from a hobby drone. They can be scattered around a city and go unnoticed.
Mr. O’Connor says he did none of that – and for a reason. In addition to being a security researcher and founder of a consulting firm called Malice Afterthought, he is also a law student at the University of Wisconsin at Madison. He says he stuck to snooping on himself – and did not, deliberately, seek to scoop up anyone else’s data – because of a federal law called the Computer Fraud and Abuse Act.
Some of his fellow security researchers have been prosecuted under that law. One of them, Andrew Auernheimer, whose hacker alias is Weev, was sentenced to 41 months in prison for exploiting a security hole in the computer system of AT&T, which made e-mail addresses accessible for over 100,000 iPad owners; Mr. Aurnheimer is appealing the case.
“I haven’t done a full deployment of this because the United States government has made a practice of prosecuting security researchers,” he contends. “Everyone is terrified.”
He is presenting his findings at two security conferences in Las Vegas this week, including at a session for young people. It is a window into how cheap and easy it is to erect a surveillance apparatus.
“It eliminates the idea of ‘blending into a crowd,’” is how he put it. “If you have a wireless device (phone, iPad, etc.), even if you’re not connected to a network, CreepyDOL will see you, track your movements, and report home.”
Can individual consumers guard against such a prospect? Not really, he concluded. Applications leak more information than they should. And those who care about security and use things like VPN have to connect to their tunneling software after connecting to a Wi-Fi hub, meaning that at least for a few seconds, their Web traffic is known to anyone who cares to know, and VPN does nothing to mask your device identifier.
In addition, every Wi-Fi network that your cellphone has connected to in the past is also stored in the device, meaning that as you wander by every other network, you share details of the Wi-Fi networks you’ve connected to in the past. “These are fundamental design flaws in the way pretty much everything works,” he said.

http://bits.blogs.nytimes.com/2013/08/02/a-cheap-spying-tool-with-a-high-creepy-factor/?_r=0

MyriadRF

The Deep Web

The Deep Web


Exploiting big data, including the 90% of data hidden in the deep web, provides new insight for law enforcement, business, government and research. Learn how to create actionable intelligence from big data in this white paper, including:
  • The value of big data
  • Who can benefit most from big data
  • How to create understanding from big data
Download this whitepaper to learn why big data matters and how to create actionable insight from the deep web.

Not Only Structured Query Language

 Approaches:

Amazon Dynamo distributed key value stores (Cassandra, VoltDB, Riak, Redis)


Google Big Table (Hbase)


Document Oriented Database (MongoDB, CouchDB, MarkLogic)


Graph Database (Neo4j)

 
Native Big Data Connectors Source: jasperforge.org
 

CLEAR (Consolidated Lead Evaluation and Reporting)

CLEAR next generation version of the investigative tool, AutoTrackXP, which has over a decade of history in the public records market. CLEAR launched to the law enforcement market in 2008 as ChoicePoint CLEAR (Consolidated Lead Evaluation and Reporting).

MeDICi Data Intensive Computing Framework

PNNL created a world-leading research program in Data Intensive Computing.

DIC is characterized by problems where data is the primary challenge, whether it is the complexity, size, or rate of the data acquisition. As the number of emerging scientific and national security problems continues to grow, so do our advancements in software and hardware architectures, analytics and visualization. We invite you to explore how PNNL is accelerating the speed of scientific discovery, decision support and threat detection across multiple disciplines.


Starlight Visual Information System (VIS)

A brief video demonstration of Starlight's capabilities including examples of social network analysis (SNA) features and web reporting functionality:


Text and UAV Video Analysis
 

Big data: The next frontier for innovation, competition, and productivity

Report from McKinsey Global Institute
 
Download Full Report (.pdf)

The amount of data in our world has been exploding, and analyzing large data sets—so-called big data—will become a key basis of competition, underpinning new waves of productivity growth, innovation, and consumer surplus, according to research by MGI and McKinsey's Business Technology Office. Leaders in every sector will have to grapple with the implications of big data, not just a few data-oriented managers. The increasing volume and detail of information captured by enterprises, the rise of multimedia, social media, and the Internet of Things will fuel exponential growth in data for the foreseeable future.
MGI studied big data in five domains—healthcare in the United States, the public sector in Europe, retail in the United States, and manufacturing and personal-location data globally. Big data can generate value in each. For example, a retailer using big data to the full could increase its operating margin by more than 60 percent. Harnessing big data in the public sector has enormous potential, too. If US healthcare were to use big data creatively and effectively to drive efficiency and quality, the sector could create more than $300 billion in value every year. Two-thirds of that would be in the form of reducing US healthcare expenditure by about 8 percent. In the developed economies of Europe, government administrators could save more than €100 billion ($149 billion) in operational efficiency improvements alone by using big data, not including using big data to reduce fraud and errors and boost the collection of tax revenues. And users of services enabled by personal-location data could capture $600 billion in consumer surplus. The research offers seven key insights.

1. Data have swept into every industry and business function and are now an important factor of production, alongside labor and capital. We estimate that, by 2009, nearly all sectors in the US economy had at least an average of 200 terabytes of stored data (twice the size of US retailer Wal-Mart's data warehouse in 1999) per company with more than 1,000 employees.

2. There are five broad ways in which using big data can create value. First, big data can unlock significant value by making information transparent and usable at much higher frequency. Second, as organizations create and store more transactional data in digital form, they can collect more accurate and detailed performance information on everything from product inventories to sick days, and therefore expose variability and boost performance. Leading companies are using data collection and analysis to conduct controlled experiments to make better management decisions; others are using data for basic low-frequency forecasting to high-frequency nowcasting to adjust their business levers just in time. Third, big data allows ever-narrower segmentation of customers and therefore much more precisely tailored products or services. Fourth, sophisticated analytics can substantially improve decision-making. Finally, big data can be used to improve the development of the next generation of products and services. For instance, manufacturers are using data obtained from sensors embedded in products to create innovative after-sales service offerings such as proactive maintenance (preventive measures that take place before a failure occurs or is even noticed).


3. The use of big data will become a key basis of competition and growth for individual firms. From the standpoint of competitiveness and the potential capture of value, all companies need to take big data seriously. In most industries, established competitors and new entrants alike will leverage data-driven strategies to innovate, compete, and capture value from deep and up-to-real-time information. Indeed, we found early examples of such use of data in every sector we examined.

4. The use of big data will underpin new waves of productivity growth and consumer surplus. For example, we estimate that a retailer using big data to the full has the potential to increase its operating margin by more than 60 percent. Big data offers considerable benefits to consumers as well as to companies and organizations. For instance, services enabled by personal-location data can allow consumers to capture $600 billion in economic surplus.

5. While the use of big data will matter across sectors, some sectors are set for greater gains. We compared the historical productivity of sectors in the United States with the potential of these sectors to capture value from big data (using an index that combines several quantitative metrics), and found that the opportunities and challenges vary from sector to sector. The computer and electronic products and information sectors, as well as finance and insurance, and government are poised to gain substantially from the use of big data.

6. There will be a shortage of talent necessary for organizations to take advantage of big data. By 2018, the United States alone could face a shortage of 140,000 to 190,000 people with deep analytical skills as well as 1.5 million managers and analysts with the know-how to use the analysis of big data to make effective decisions.

7. Several issues will have to be addressed to capture the full potential of big data. Policies related to privacy, security, intellectual property, and even liability will need to be addressed in a big data world. Organizations need not only to put the right talent and technology in place but also structure workflows and incentives to optimize the use of big data. Access to data is critical—companies will increasingly need to integrate information from multiple data sources, often from third parties, and the incentives have to be in place to enable this.


Podcast Download Distilling value and driving productivity from mountains of data

MGI senior fellow Michael Chui discusses how the scale and scope of companies' access to data is changing the way they do business.